顯示具有 SQL Server Troubleshooting 標籤的文章。 顯示所有文章

2023年12月5日 星期二

SQL Server has encountered the following error: operating system returned error 19 or Could not allocate space for object in database because the PRIMARY filegroup is full

SQL Server has encountered the following error:  

1.Error operating system returned error 19 

2.Could not allocate space for object in database because the PRIMARY filegroup is full


Possible Cause:

外接SAN/iSCSI Storage磁碟機,指派的可用空間超過Storage實際可用空間,作業系統看到的空間並非Stoage實際可用空間,當Storage空間不足,SQL Server就會出現以下錯誤訊息,導致疑難排解困難,因為作業系統或SQL Server所看到可用空間是足夠的,但卻出現空間不足訊息

例如:  另一種可能是VMware 超額分配可用空間

Dynamic Storage Provisioning / vSphere Storage Thin Provisioning 


Error Message:

Error 1:

The operating system returned error 19(The media is write protected.) to SQL Server during a write at offset 0000000000000000 in file 'N:\SQLData\xxxx2.ndf'. Additional messages in the SQL Server error log and operating system error log may provide more detail. This is a severe system-level error condition that threatens database integrity and must be corrected immediately. Complete a full database consistency check (DBCC CHECKDB). This error can be caused by many factors; for more information, see SQL Server Books Online.

Error 2:

Could not allocate space for object in database because the 'PRIMARY' filegroup is full.


Resolution:

1.從Storage端,增加磁碟擴充可用空間

2.從OS端,因為Storage端空間已經不足,即使OS端檔案總管看到還有可用空間,但仍然需要刪除一些檔案來增加更多可用空間。


2020年4月15日 星期三

Microsoft.ACE.OLEDB.12.0 provider is not registered

SQL Server Import and Export Wizard
The 'Microsoft.ACE.OLEDB.12.0' provider is not registered on the local machine


1.當SSMS是在x64的主機,且主機有安裝64bit Office,此時只能下載安裝AccessDatabaseEngine_X64.exe

Microsoft Access Database Engine 2010 Redistributable
https://www.microsoft.com/en-us/download/details.aspx?displaylang=en&id=13255

然後,使用64 bit的SQL Server Import and Export Wizard
C:\Program Files\Microsoft SQL Server\150\DTS\Binn\DTSWizard.exe

2.當SSMS是在x64的主機,且主機有安裝32bit Office,此時只能下載安裝AccessDatabaseEngine.exe

Microsoft Access Database Engine 2010 Redistributable
https://www.microsoft.com/en-us/download/details.aspx?displaylang=en&id=13255

然後,使用32 bit的SQL Server Import and Export Wizard
C:\Program Files (x86)\Microsoft SQL Server\150\DTS\Binn\DTSWizard.exe


2019年11月27日 星期三

使用 SQL Server Profiler 檢視和分析追蹤

使用 SQL Server Profiler 檢視和分析追蹤

測量單位

  • Duration: SQL Server Profiler 顯示 Duration column in milliseconds(10-3 of a second) by default. Trace儲存到檔案或資料表時 in microseconds(10-6 of a second)
  • CPU: in milliseconds(10-3 of a second)


使用
1.啟動SQL Server Profiler

2.新增一個追蹤New Trace

3.登入欲追蹤的SQL Server

4.追蹤屬性設定視窗
    有兩個頁籤,預設顯示一般設定(General)頁籤

5.預設的追蹤事件
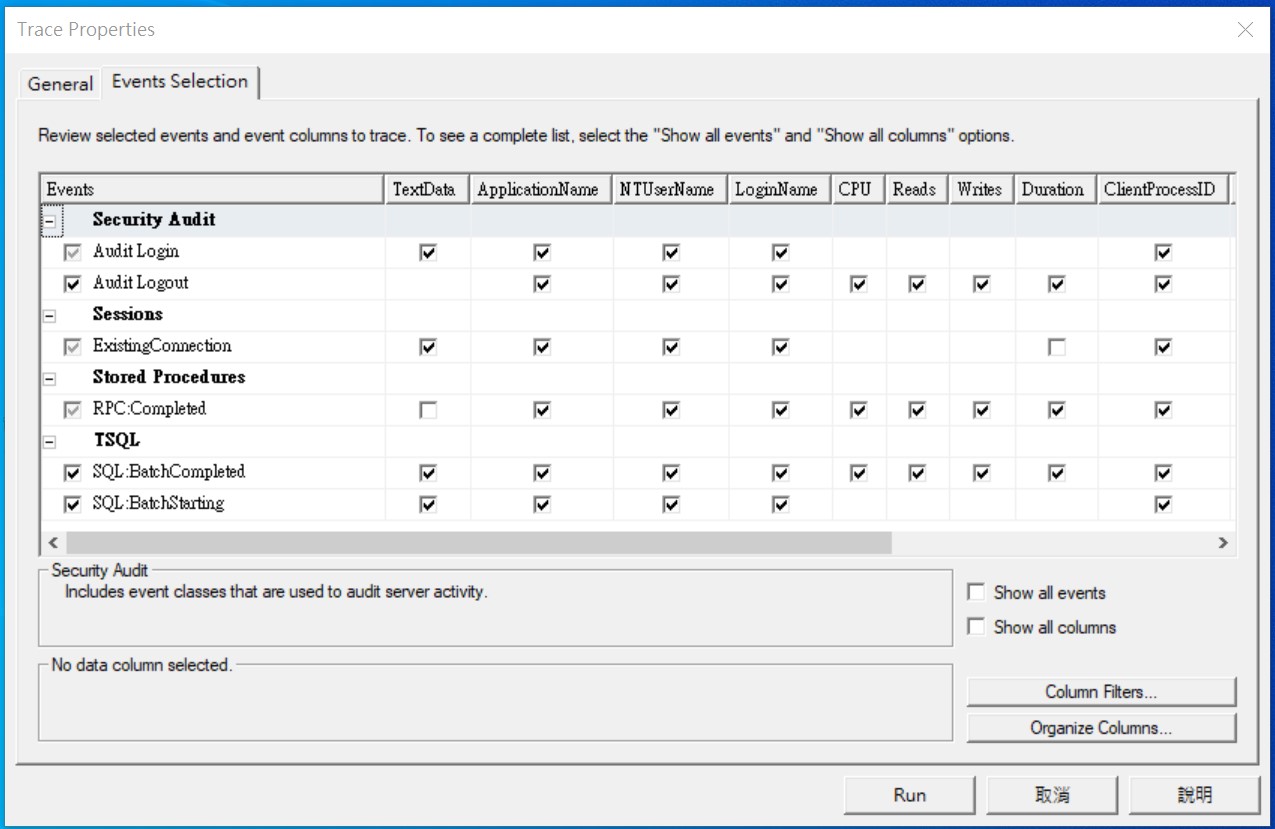
切換到事件選取(Events Selection)頁籤,可自訂事件(勾選需要的事件)

6.使用追蹤範本
   也可在一般設定(General)頁籤,依據不同追蹤目的可選擇不同的範本,不同的範本有定義不同的追蹤事件Events,選取後Event Selection頁籤的事件就會依據所選的範本而變動

7.若要自訂追蹤事件
    在事件選取(Events Selection)頁籤,可勾選Show all events顯示所有事件,才會顯示所有事件

    部分不常用追蹤欄位預設是隱藏的,可勾選Show all columns,才會顯示所有可用欄位

    展開前方的加號(+),就可以勾選該類別的各別事件與特定的欄位

    若需要過濾事件,可以點選Column filters,再去設定特定欄位的過濾條件
    例如預設已設定不會收集到SQL Server Profiler本身所執行的SQL Query。


8.設定追蹤儲存至實體檔案
   若需要在追蹤時就儲存實體檔案,則可在一般設定(General)頁籤
   (1)勾選Save to file,並指定檔案位置與檔名
   (2)建議設定追蹤檔大小上限,在set maximum file size輸入350
   (3)預設啟用檔案換用Enable file rollover,建議保留不動
   (4)預設不啟用伺服器處理追蹤資料,建議保留不動。
       若啟用時,因為當SQL Server負載大極度忙碌時,也不會略過追蹤,可能會造成性能的影響
     "Server processes trace data" tells the service running the trace to process the trace data and not the client application. With this option selected no trace data will ever be skipped even if the server is extremely busy, but note that your server performance may be affected if this happens


9.設定追蹤儲存至資料表
    不建議啟用,此動作可在收集完成後再手動進行匯入資料表。
    若勾選了,則要選擇連線到目的地SQL Servre與資料表。


10.設定自動停止追蹤
    若有需要自動停止追蹤,則勾選Enable trace stop time,然後指定一個停止日期與時間之後,當追蹤開始收集,就會自動在指定的時間自動停止。

Check the "Enable trace stop time" checkbox and give the time at which you want to stop track, SQL Server will automatically stop trace on that time.

11.開始收集追蹤
     按下 Run 就會開始執行收集


12.開始收集時的畫面如下
    可透過上方的工具列,按下暫停可暫停追蹤,但下停止可以停止追蹤。


13.另存追蹤
   按下File>Save As>Trace File... 可將目前顯是的追蹤內容,儲存到實體檔案
   按下File>Save As>Trace Table... 可將目前顯是的追蹤內容,儲存到資料表


分析案例
如果是SSIS Package資料流data flow的OLE DB Source - SQL Command with Parameter,則錄不到傳入的參數值,RPC:: Completed只會出現@P1, @P2
既使有選擇Stored Procedure與TSQL所有Event,仍然找不到傳入的參數值


2016年10月15日 星期六

Log Shipping Monitoring and Troubleshooting 交易紀錄傳送監控與疑難排解

Log Shipping Monitoring and Troubleshooting
交易紀錄傳送監控與疑難排解


1.Log Shipping status
View the Log Shipping Report (SQL Server Management Studio)
https://msdn.microsoft.com/en-us/library/ms181149.aspx

To display the Transaction Log Shipping Status report on a server instance


  1. Connect to a monitor server, primary server, or secondary server.
  2. Right-click the server instance in Object Explorer, point to Reports, and point to Standard Reports.
  3. Click Transaction Log Shipping Status.

sp_help_log_shipping_monitor (Transact-SQL)
https://msdn.microsoft.com/en-us/library/ms187820.aspx

sp_help_log_shipping_monitor

Remarks
sp_help_log_shipping_monitor must be run from the master database on the monitor server.

Permissions
Requires membership in the sysadmin fixed server role.

找出Monitoring Server方法

SELECT monitor_server FROM msdb.dbo.log_shipping_primary_databases;
or
SELECT monitor_server FROM msdb.dbo.log_shipping_secondary;

2.Job History

View the Job History
https://msdn.microsoft.com/en-us/library/ms181046.aspx

To view the job history log


  1. In Object Explorer, connect to an instance of the SQL Server Database Engine, and then expand that instance.
  2. Expand SQL Server Agent, and then expand Jobs.
  3. Right-click a job, and then click View History.
  4. In the Log File Viewer, view the job history.
  5. To update the job history, click Refresh. To view fewer rows, click the Filter button and enter filter parameters.

or

-- lists all job information for the NightlyBackups job.  
USE msdb ;  
GO  

EXEC dbo.sp_help_jobhistory   
    @job_name = N'LSRestore_ServerName_DBname' ;  
GO

3.Backup and Restore History
Backup History and Header Information (SQL Server)
https://msdn.microsoft.com/en-us/library/ms188653.aspx

Query SQL Server backup history and restore history records
https://blogs.msdn.microsoft.com/bradchen/2014/03/12/query-sql-server-backup-history-and-restore-history-records/

4.ERRORLOG
View the SQL Server Error Log (SQL Server Management Studio)
https://msdn.microsoft.com/en-us/library/ms187109.aspx

  1. In Object Explorer, connect to an instance of the SQL Server and then expand that instance.
  2. Find and expand the Management section (Assuming you have permissions to see it).
  3. Right-click on SQL Server Logs, select View, and choose View SQL Server Log.


5.Event log
Start Event Viewer
https://technet.microsoft.com/en-us/library/cc766401(v=ws.11).aspx

To start Event Viewer by using the Windows interface


  1. Click the Start button.
  2. Click Control Panel .
  3. Click System and Maintenance .
  4. Click Administrative Tools .
  5. Double-click Event Viewer .

To start Event Viewer by using a command line


  1. Open a command prompt. To open a command prompt, click Start , click All Programs , click Accessories and then click Command Prompt .
  2. Type eventvwr .

Reference:
Monitor Log Shipping (Transact-SQL)
https://msdn.microsoft.com/en-us/library/ms190224.aspx

Stored procedureDescriptionRun this procedure on
sp_help_log_shipping_monitor_primaryReturns monitor records for the specified primary database from the log_shipping_monitor_primary table.Monitor server or primary server
sp_help_log_shipping_monitor_secondaryReturns monitor records for the specified secondary database from the log_shipping_monitor_secondary table.Monitor server or secondary server
sp_help_log_shipping_alert_jobReturns the job ID of the alert job.Monitor server, or primary or secondary server if no monitor is defined
sp_help_log_shipping_primary_databaseRetrieves primary database settings and displays the values from the log_shipping_primary_databases and log_shipping_monitor_primary tables.Primary server
sp_help_log_shipping_primary_secondaryRetrieves secondary database names for a primary database.Primary server
sp_help_log_shipping_secondary_databaseRetrieves secondary-database settings from the log_shipping_secondarylog_shipping_secondary_databasesand log_shipping_monitor_secondary tables.Secondary server
sp_help_log_shipping_secondary_primary (Transact-SQL)This stored procedure retrieves the settings for a given primary database on the secondary server.Secondary server

Bring Database back to norecovery mode from standby mode(Standby / Read-Only)

RESTORE DATABASE [AdventureWorks]
WITH NORECOVERY;

Adding a log shipping monitor
http://www.sqlservercentral.com/articles/Log+Shipping/77295/


2009年7月7日 星期二

使用統計資料來改善查詢效能-節錄SQL Server 2008 線上叢書-Technet Library

使用統計資料來改善查詢效能
http://technet.microsoft.com/zh-tw/library/ms190397.aspx

在下列狀況中,請考慮更新統計資料:

(1)查詢執行時間很慢
如果查詢回應時間很慢或無法預測,請先確定查詢具有最新的統計資料,然後再執行其他疑難排解步驟。如需有關疑難排解查詢執行緩慢的詳細資訊,請參閱<分析執行緩慢之查詢的檢查清單>。

(2)插入作業針對遞增或遞減索引鍵資料行進行
遞增或遞減索引鍵資料行 (例如 IDENTITY 或即時時間戳記資料行) 之統計資料所需的統計資料更新頻率可能會比查詢最佳化工具所執行的更新頻率更高。插入作業會將新的值附加至遞增或遞減資料行。所加入的資料列數目可能會太小,而無法觸發統計資料更新。如果統計資料不是最新的,而且查詢會從最近加入的資料列中選取,則目前的統計資料將不會具有這些新值的基數估計值。這可能會導致基數估計值不精確以及查詢效能緩慢。

例如,如果統計資料沒有更新成包含最新銷售訂單日期的基數估計值,則從最新銷售訂單日期中選取的查詢就會具有不精確的基數估計值。

(3)在維護作業之後
在執行變更資料分佈的維護程序 (例如截斷資料表或針對大部分的資料列執行大量插入) 之後,請考慮更新統計資料。這樣做可在查詢等候自動統計資料更新時,避免未來查詢處理產生延遲。

重建、重組或重新組織索引等作業都不會變更資料的分佈。因此,在執行 ALTER INDEX REBUILD、DBCC REINDEX、DBCC INDEXDEFRAG 或 ALTER INDEX REORGANIZE 作業之後,您不需要更新統計資料。當您使用 ALTER INDEX REBUILD 或 DBCC DBREINDEX 來重建資料表或檢視表的索引時,查詢最佳化工具就會更新統計資料。不過,這種統計資料更新是重新建立索引的副產品。在 DBCC INDEXDEFRAG 或 ALTER INDEX REORGANIZE 作業之後,查詢最佳化工具則不會更新統計資料。

[Action]
-- 更新資料庫的所有統計資料
EXEC sp_updatestats
--若要判斷上次更新統計資料的時間,請使用 STATS_DATE 函數。
--http://technet.microsoft.com/zh-tw/library/ms173804.aspx


--針對 SalesOrderDetail 資料表的所有索引更新統計資料。
--複製程式碼
USE AdventureWorks;
GO
UPDATE STATISTICS Sales.SalesOrderDetail;
GO
http://technet.microsoft.com/zh-tw/library/ms187348.aspx

2009年6月30日 星期二

SQL Server Memory pool(Buffer Pool) - Procedure Cache and Data Cache

-- SQL Server 7.0之前(SQL Server 6.5),Data Cache與Procedure Cache有獨立控制的memory pool
-- SQL Server 7.0與SQL Server 2000則是共用一個memory pool
--
-- 此memory pool即Buffer pool
-- The buffer pool is managed by a process called the lazywriter

--01.Procedure cache (execution plan cache)

select * from master.dbo.syscacheobjects

--DBCC PROCCACHE
--GO

--Free Porcedure Cache
-- Method 1: Free Porcedure Cache by database
--SELECT DB_ID('pubs')
--DBCC FLUSHPROCINDB (5)
--GO
--
-- Method 2 -Free All Porcedure Cache
-- DBCC FREEPROCCACHE
-- GO


-- 02.Data Buffer Cache
-- Get TOP 20 objects in the data cache
-- BUG: DBCC MEMUSAGE Is Not Supported in SQL Server 7.0
--The DBCC MEMUSAGE statement is not supported in SQL Server 7.0. Executing it on servers running heavy loads with large databases may cause the server to stop responding.
-- http://support.microsoft.com/default.aspx?scid=kb;en-us;196629

DBCC MEMUSAGE

-- Free Buffer Cache
-- DBCC DROPCLEANBUFFERS

-- Force all dirty pages to be written to disk
--CHECKPOINT
--GO


-- 03.Other Useful Command - DBCC MEMORYSTATUS
USE master
GO
DBCC MEMORYSTATUS
GO

-- 04.Other Useful Command - DBCC PINTABLE (@db_id,@object_id)
-- 微軟不建議使用以下功能,但仍然可以使用,建議在測試環境才使用
-- keep a table's data pages in memory
-- demo Database named pubs
USE pubs
GO
select DB_ID('pubs')
GO
-- return 5
select OBJECT_ID('dbo.jobs')
GO
-- return 277576027
DBCC PINTABLE (5,277576027)
GO

-- release a pinned table's data pages from memory.
USE pubs
GO
select DB_ID('pubs')
GO
-- return 5
select OBJECT_ID('dbo.jobs')
GO
-- return 277576027
DBCC UNPINTABLE (5,277576027)
GO

[reference]
Analyzing SQL Server 2000 Data Caching
How to Interact with SQL Server's Data and Procedure Cache

資料治理實施

資料治理實施